Comprehensive data insights and one-stop mastery of interactive results
With clear charts and complete behavioral data, you can gain an in-depth understanding of interaction performance such as chat volume, sources, and questionnaire responses, helping you quickly identify traffic sources, optimize customer service processes, and improve conversion results.
Main features
Gain in-depth insights into conversation data and user behavior to help you understand service effectiveness and continuously optimize operational strategies
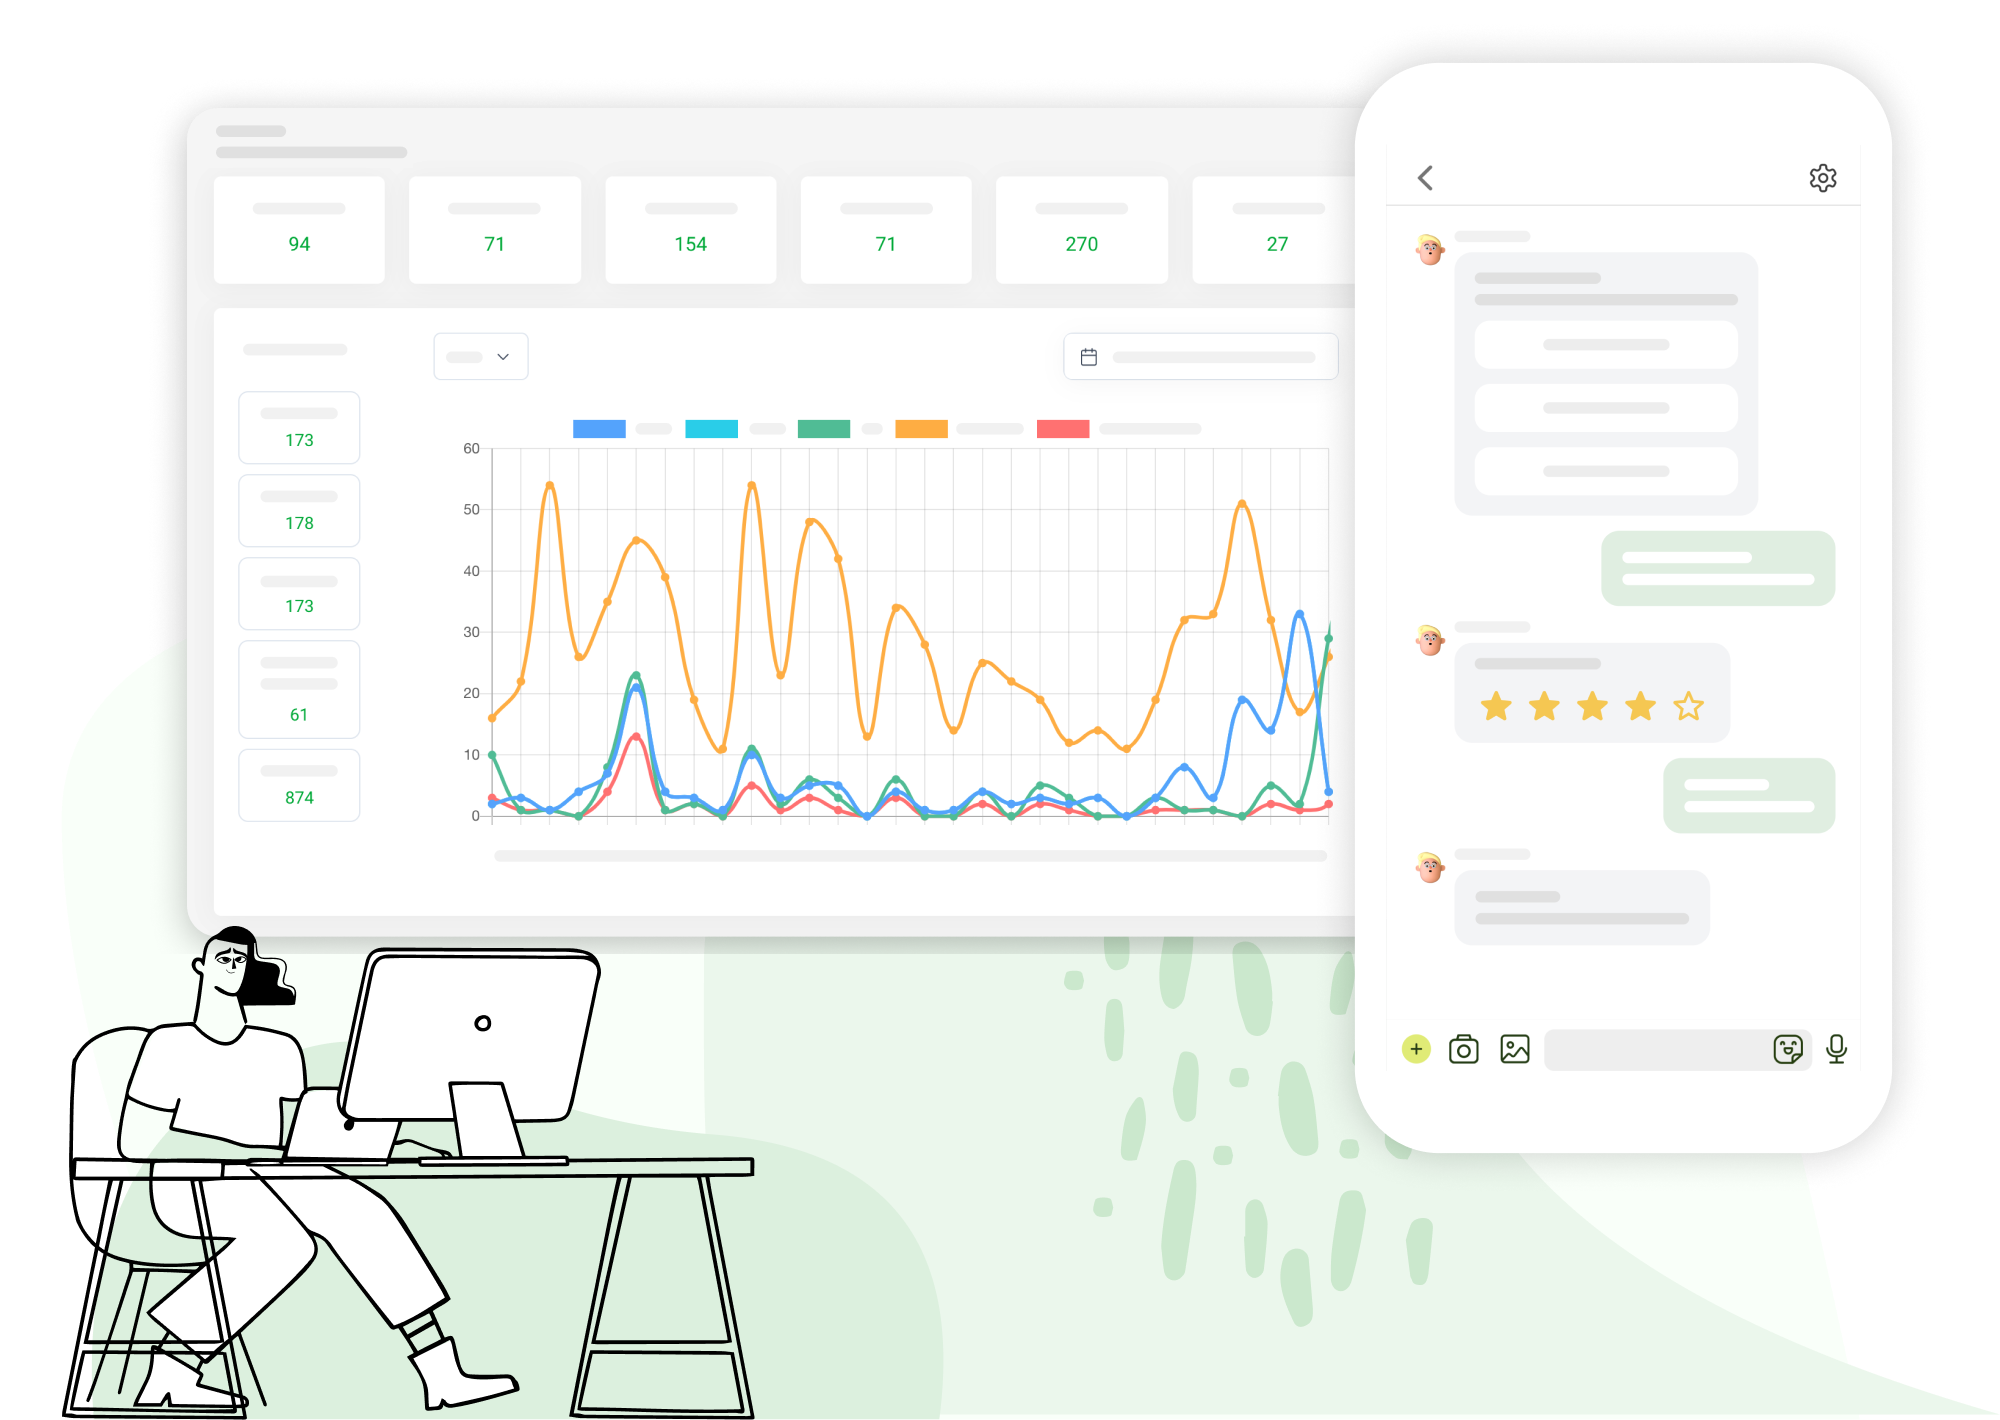
Chat volume and interaction trends
Use multi-dimensional charts to understand chat volume, active periods and customer service burden to help you optimize operational rhythm and manpower allocation.
- ✓View daily and periodic chat volume changes
- ✓Analyze peak hours and user active times
- ✓Track chat interaction performance and source differences
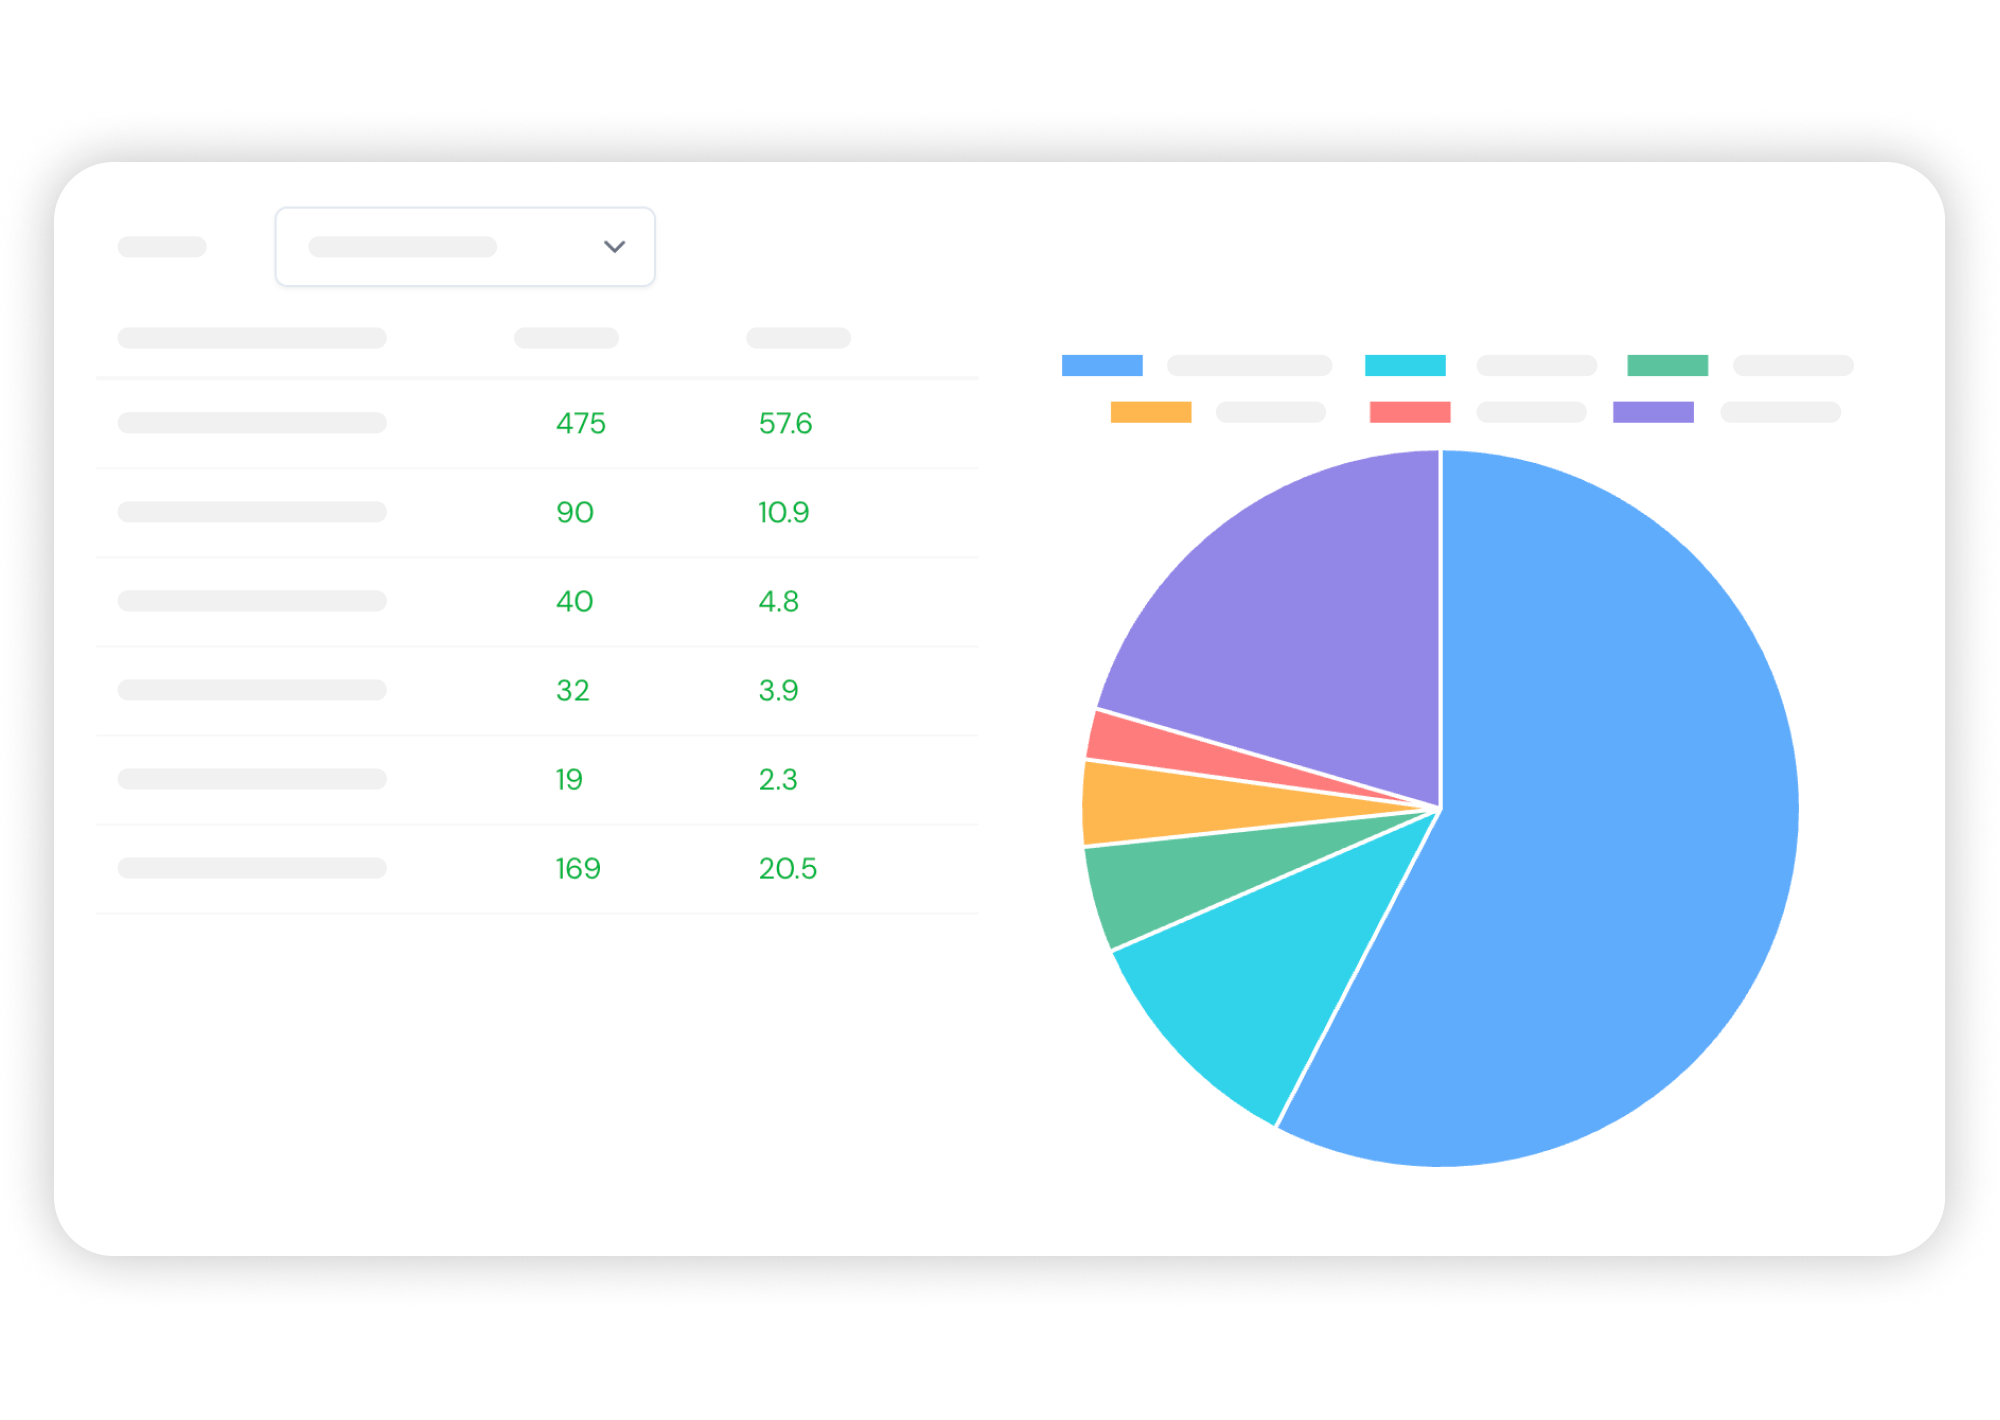
Visitor source and conversion analysis
Comprehensively understand each user's entry channels and interaction performance to help you determine which sources bring the best results.
- ✓Track the proportion of visitors coming from different entrances
- ✓Analyze the interaction depth and effectiveness of each traffic source
- ✓Evaluate the conversion performance of different channels during the campaign
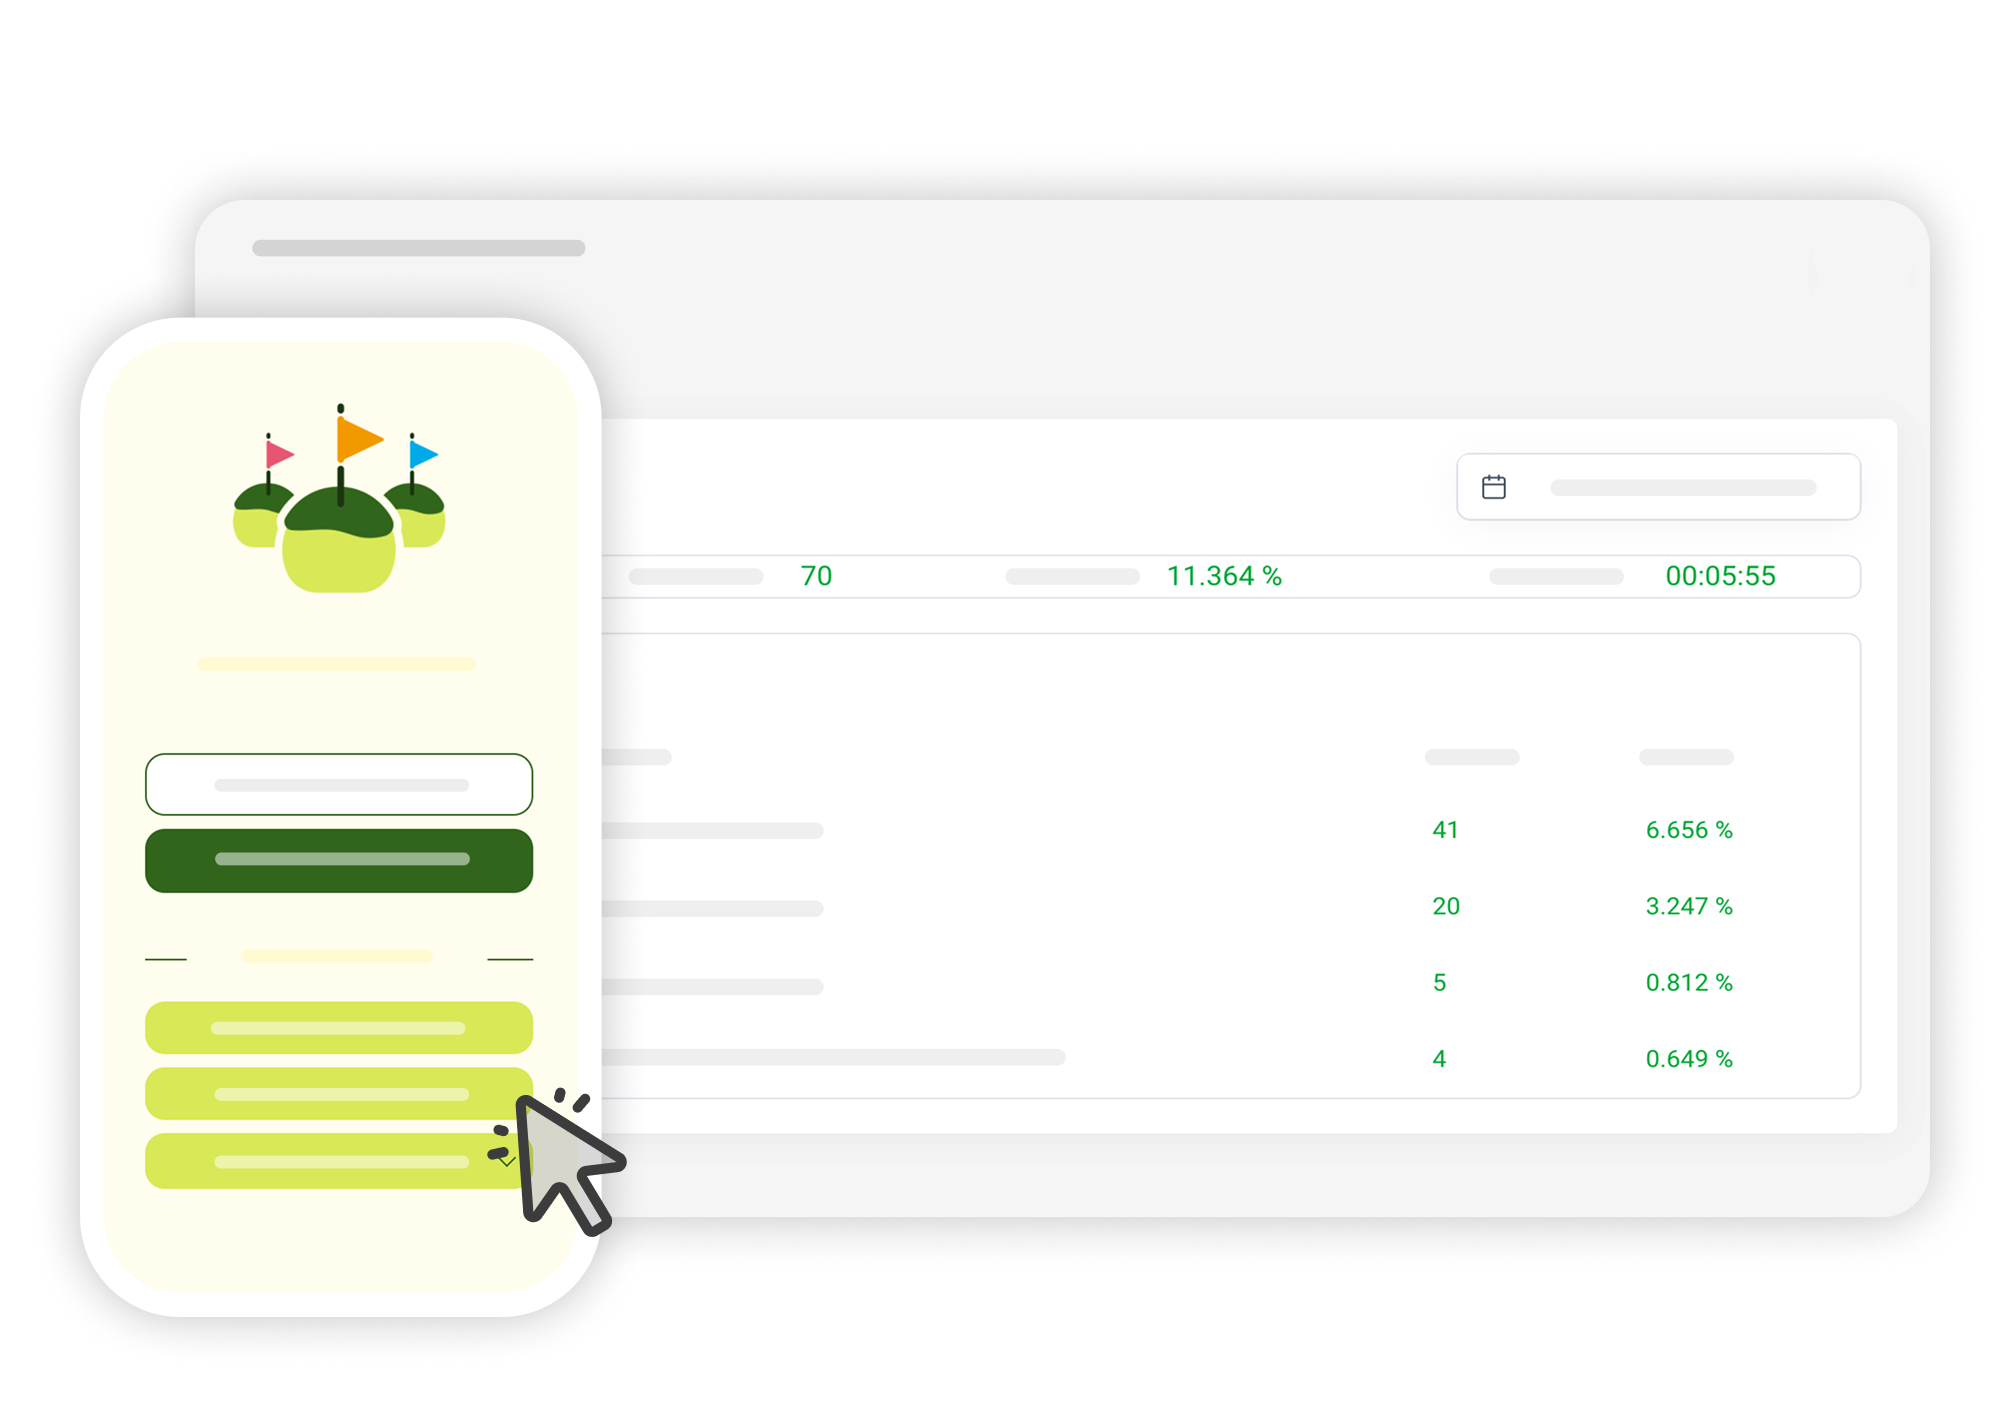
Button and link click insights
Link click analysis specially designed for the welcome page helps you understand the actual traffic diversion effect of each button and quickly adjust the traffic diversion strategy.
- ✓Track the actual number of clicks on each button and link on the welcome page
- ✓Analyze visitors’ navigation behavior and preferences within the welcome page
- ✓Evaluate welcome page button configuration and activity diversion effect
Questionnaire responses and user opinions
The conversational questionnaire response data is completely presented to quickly understand customer opinions, satisfaction and demand trends.
- ✓View the response distribution and statistical indicators of each question
- ✓Track user submission rates and completion
- ✓Aggregate feedback for product and operational decisions
Explore other features
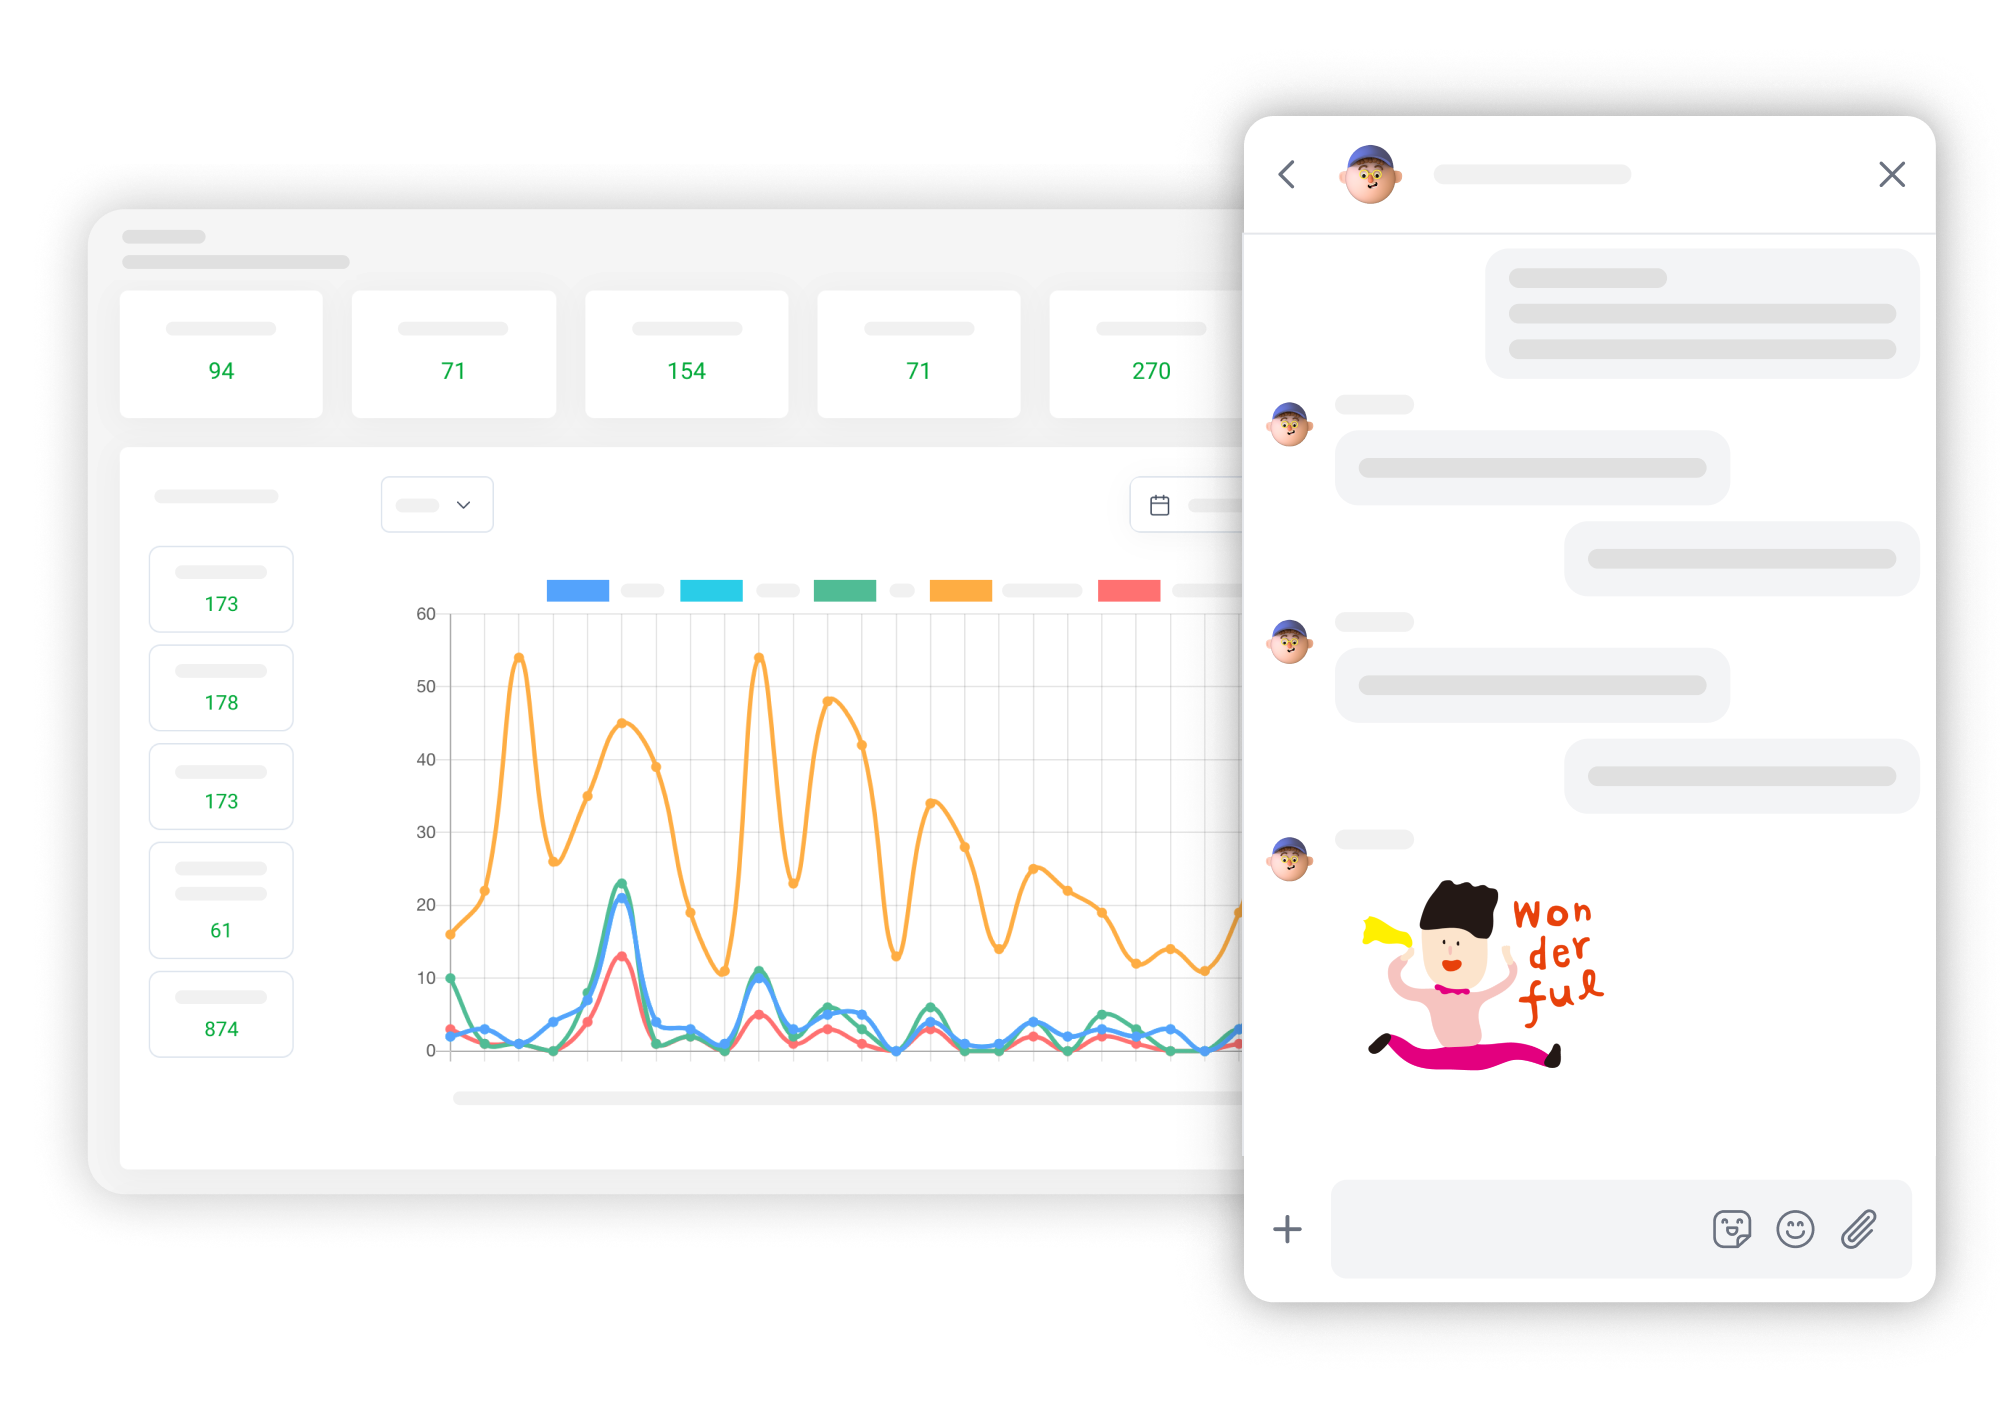
Live chat system
Supports one-on-one and group chats, multimedia messaging, and an adjustable interface, allowing brands and users to maintain natural, real-time, and high-quality two-way interactions.
Sub-account management
Easily manage the operating scope of multiple members through role and permission control to achieve efficient team collaboration.
Chat room management
Keep track of all chats with labels, folders and quick searches, allowing customer service and sales teams to find important messages faster.